Profitability Differences
Building a business is a lot of work. Thus, it makes sense to build your business in an industry where the fundamental dynamics are a little more in your favor. Or, evolve your business to improve its fundamental characteristics by studying the best.
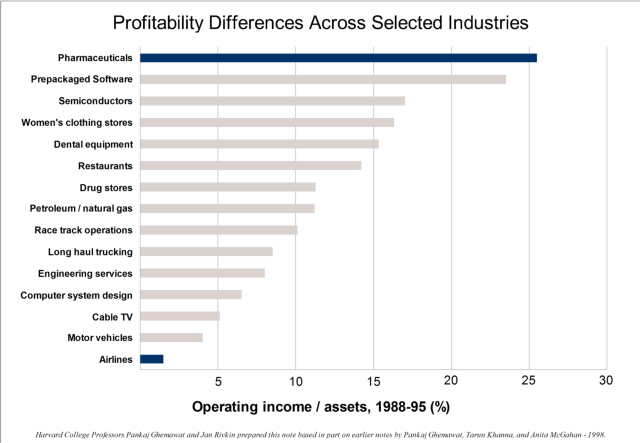
This hit home for me during my strategy classes at Harvard Business School with Jan Rivkin. Early in our strategy class, he put up this chart that compared profitability across selected industries. It made it obvious that we could bang our heads against the wall for decades as an airline or car company and never achieve reasonable profits. It is much better to focus ones efforts where the odds of success are much greater.
A Few Observations from the Chart:
- Since the data was through 1995, I imagine that Internet based business and Software-as-a-Service (SaaS) business models are probably even better than prepackaged software.
- With pharmaceuticals being the only industry in this chart over 25%, I imagine that their profitability levels have declined since the mid-1990s’.
- I was surprised that restaurants are in the middle of the pack because conventional wisdom is that restaurants are difficult businesses.
- To me, it reinforces the idea that gross margins are critically important. While I am sure Walmart probably has strong profit margins, the chart makes it appear that products/services with high gross margins make it much easier to achieve higher profit margins. Sort of obvious, but worth stating.
Because we all only have so many hours to focus on business and everything requires dedication and intense effort, focusing your activity where the odds are best for success is an idea I have heard expressed in similar ways over the years. Venture capitalists can be heard to say that they prefer companies focused on a big problem in a large and growing market. Some vc’s think the size of the market is the most critical piece of assessing a business (part of the never-ending debate of whether the team or the market is more important). In buying or investing in businesses, it can be heard that it is as much work to buy a small business as a large business, so you might was well focus on buying larger businesses.
How does your industry compare to the chart? How does your business compare to its industry? Are there things that you can do to improve your company to make it more like the industries that have higher profitability?
Related Posts
- Chart on Economies of Scale, August 14, 2012
- Elusive Moats of Competitive Advantage, April 10, 2012
- Assessing the Width of Your Business Moat (To Sell or Not To Sell, a series), May 14, 2012
- Coca Cola vs Wine (Perfect Business, Financially Speaking), May 8, 2012


 I am an investor at Greybull Stewardship, an
 Sign Up
 RSS Feed
By Competitive Advantage, Financing, Business Investment Partnership | Business Investment Blog For Business Owners January 7, 2013 - 3:17 pm
[…] Chart of Most Profitable Industries — Improve Your Odds of Business Success (masonmyers.com, August 28, 2012) […]
By Recurring Revenue Businesses, Business Models | Building Your Business Blog August 13, 2013 - 12:42 pm
[…] Chart of Most Profitable Industries — Increase Your Odds of Business Success [masonmyers.com -… Categories:Charts & Graphs, Investment & Business Models, Perfect Financial Structure of a Business (a series)Tags:Berkshire Hathaway, Business Growth, Business Growth & Opportunities, Business Growth Strategy, Business Strategy, Cash Flow, Charlie Munger, Execution, Financial Results, Financial Strategy, Growth Rate, Growth Rates, Investment, Investment Strategy, Recurring Revenue, Return on Investment, Warren Buffett /* […]
By Investment Returns Are Not Greener by Changing Industries - Mason Myers Blog January 26, 2014 - 10:09 am
[…] success by selecting a superior market or industry? We have discussed this previously with this chart of the most profitable industries and thinking about persistently high returns through competitive […]